The Bible is the most widely distributed book in history, but its modern “reach” is best understood through measurable indicators: translation coverage, print and digital distribution, reading habits, and sales trends. Below is a data-driven snapshot using the most recent global and national reporting available.
7,393 languages are counted worldwide; 3,272 still have no Scripture available. (Wycliffe, updated Feb 2, 2026)
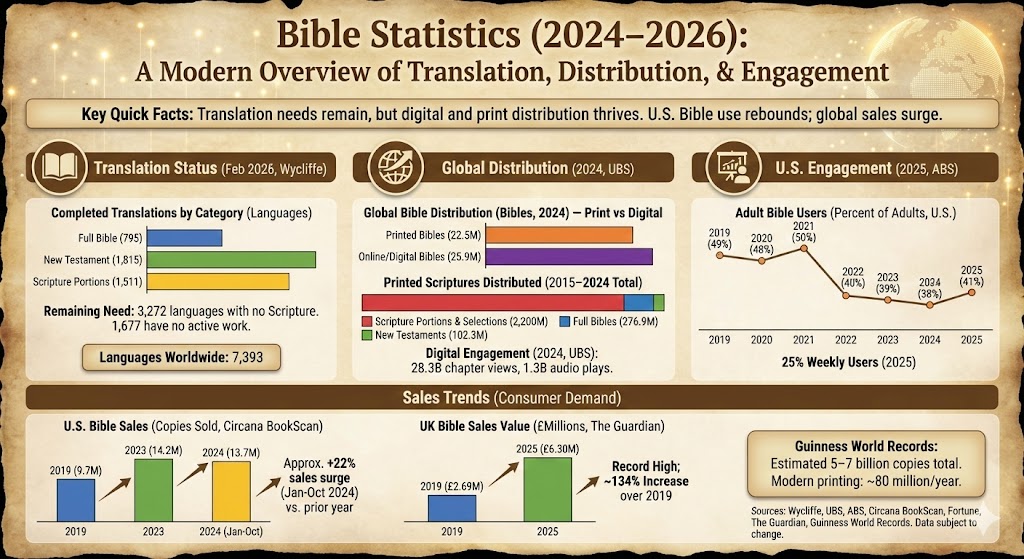
795 languages have a full Bible, 1,815 have a New Testament, and 1,511 have portions of Scripture. (Wycliffe, Feb 2026)
4,423 languages have translation work in progress. (Wycliffe, Feb 2026)
1,677 languages have no Scripture and no active work in progress. (Wycliffe, Feb 2026)
In 2024, the UBS Fellowship distributed 150+ million printed Scriptures and facilitated 25.9 million digital Bible downloads across 240 countries/territories. (UBS via Bible Society reporting)
In 2024, UBS reported 28.3 billion chapter views and 1.3 billion audio plays in digital Scripture engagement. (UBS reporting)
In the U.S., 41% of adults were “Bible Users” in 2025 (defined as using the Bible on their own at least 3 times per year). (American Bible Society)
In the U.S., 25% of adults were weekly Bible users in 2025. (American Bible Society)
U.S. Bible sales were reported at 9.7M (2019) and 14.2M (2023), with 13.7M sold in the first 10 months of 2024. (Circana BookScan figures reported by Fortune)
In the UK, Bible sales in 2025 reached £6.3M, reported as 134% higher than 2019. (The Guardian)
Guinness World Records summarizes the Bible at an estimated 5–7 billion copies, and notes modern printing at roughly ~80 million per year. (Guinness World Records)
Bible Translation Statistics (February 2026)
Translation progress is often tracked by language coverage (full Bible, New Testament, or selected portions). Wycliffe’s ProgressBible snapshot (updated February 2, 2026) reports the following completed translation counts by category.
Bar Chart: Completed Bible Translations by Category (Languages)
Category
Bar
Value
Full Bible
795
New Testament
1,815
Scripture portions
1,511
Max = 1,815. Widths: Full Bible 43.80%, New Testament 100.00%, Scripture portions 83.25%.
Wycliffe also reports 3,272 languages with no Scripture available yet, and 1,677 languages with no Scripture and no active work in progress (Feb 2026). This is one reason many translation organizations frame the remaining need in population terms (e.g., “1 in 5 people still waiting”).
Global Bible Distribution and Digital Engagement (2024)
Global reporting is often split between Bibles (complete books) and broader Scriptures (which can include New Testaments and selected portions). The UBS Fellowship’s 2024 reporting highlights both formats.
Bar Chart: Global Bible Distribution (Bibles) — Print vs Digital (2024)
Beyond “Bibles,” UBS Fellowship reporting for 2024 also describes the broader scale of printed Scriptures (including portions and New Testaments) and very large volumes of digital engagement (chapter views and audio plays).
Bar Chart: Printed Scriptures Distributed (2015–2024 Total, by Type)
Type
Bar
Value
Scripture Portions & Selections
2,200M
Full Bibles
276.9M
New Testaments
102.3M
Max = 2,200M. Widths: Scripture Portions & Selections 100.00%, Full Bibles 12.59%, New Testaments 4.65%.
For digital engagement in 2024, UBS reporting also highlights 28.3 billion chapter views and 1.3 billion audio plays—showing that “distribution” increasingly includes ongoing consumption, not just copies shipped or downloaded.
Bible Use in the United States (2019–2025)
The American Bible Society’s State of the Bible 2025 defines “Bible Users” as adults who use the Bible on their own at least three times per year (excluding church services). Under that definition, the U.S. saw a decline after 2021 and then a modest rebound in 2025.
Bar Chart: Adult Bible Users in the U.S. (Percent of Adults)
In the same 2025 reporting, weekly Bible users were reported at 25% of U.S. adults, and a majority of Bible users reported accessing the Bible digitally (with “Bible website,” “Bible app,” and “YouTube” appearing as leading platforms).
Bible Sales Trends
Sales are not the same as distribution, but they are a useful indicator of consumer demand (especially in markets where many Bibles are also given away). Recent reporting using Circana BookScan has highlighted a sales surge in the U.S., and separate retail data points to record-high sales value in the UK in 2025.
Bar Chart: U.S. Bible Sales (Reported Copies Sold)
Multiple outlets have summarized the U.S. surge as roughly +22% in Bible sales through the end of October 2024 compared with the prior year, based on Circana BookScan reporting.
Bar Chart: UK Bible Sales Value (2019 vs 2025)
Year
Bar
Value
2019
£2.69M
2025
£6.30M
Max = £6.30M. Widths: 2019 42.70%, 2025 100.00%.
Note: The 2019 UK value is derived from the reported 2025 total (£6.3M) and the reported increase over 2019 (£3.61M), implying ~£2.69M in 2019.
Best-Selling and Printing Volume
Because the Bible is often distributed free of charge by religious organizations, “copies sold” can understate real circulation. Guinness World Records summarizes an estimated 5–7 billion copies and notes that modern printing occurs at around ~80 million per year. Guinness also cites a historical estimate of 2.458 billion Bibles printed between 1815 and 1975 (based on a British and Foreign Bible Society study).
Bible Society Australia (UBS distribution highlights for 2024): https://www.biblesociety.org.au/blog/how-150-million-scriptures-were-shared-worldwide-in-2024/
UBS Christian Publishing (UBS Fellowship summary of 2024 distribution): https://ubscp.org/2-6-billion-scriptures-distributed/
Christian Today (UBS Scripture Distribution Statistics report summary): https://www.christiantoday.com/news/digital-bible-distribution-outstrips-print-worldwide-for-the-first-time
American Bible Society (State of the Bible: USA 2025, PDF): https://www.americanbible.org/wp-content/uploads/2025/08/SOTB-2025-08-Final.pdf
The Guardian (UK Bible sales record high in 2025): https://www.theguardian.com/world/2026/jan/10/its-younger-people-seeking-some-sort-of-spirituality-the-rise-of-uk-bible-sales
Guinness World Records (best-selling book, Bible estimate and printing rate): https://www.guinnessworldrecords.com/world-records/best-selling-book-of-non-fiction