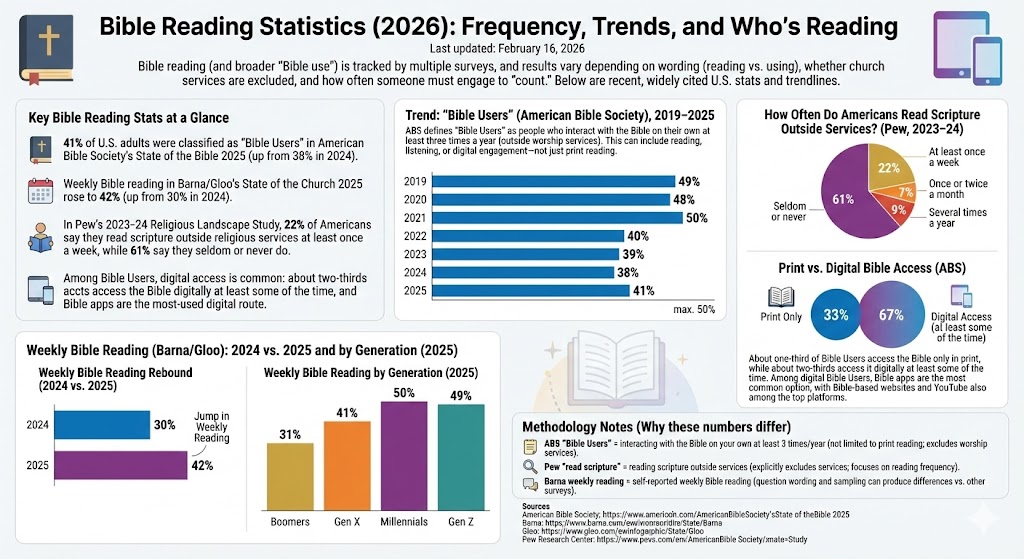
Bible reading (and broader “Bible use”) is tracked by multiple surveys, and results vary depending on wording (reading vs. using), whether church services are excluded, and how often someone must engage to “count.” Below are recent, widely cited U.S. stats and trendlines.
41% of U.S. adults were classified as “Bible Users” in American Bible Society’s State of the Bible 2025 (up from 38% in 2024).
Weekly Bible reading in Barna/Gloo’s State of the Church 2025 rose to 42% (up from 30% in 2024).
In Pew’s 2023–24 Religious Landscape Study, 22% of Americans say they read scripture outside religious services at least once a week, while 61% say they seldom or never do.
Among Bible Users, digital access is common: about two-thirds access the Bible digitally at least some of the time, and Bible apps are the most-used digital route.
American Bible Society (ABS) defines “Bible Users” as people who interact with the Bible on their own at least three times a year (outside worship services). This can include reading, listening, or digital engagement—not just print reading.
Weekly Bible reading rebound (Barna/Gloo): 2024 vs. 2025
Barna’s State of the Church 2025 (with Gloo) reported a jump in weekly Bible reading among U.S. adults—from 30% in 2024 to 42% in 2025.
Label
Bar
Value
2024
30%
2025
42%
Max = 42%. Widths: 2024 71.43%, 2025 100.00%
Weekly Bible reading by generation (Barna/Gloo), 2025
In the same Barna/Gloo release, weekly Bible reading was reported at 31% among Boomers, 41% among Gen X, 50% among Millennials, and 49% among Gen Z (U.S. adults).
Label
Bar
Value
Boomers
31%
Gen X
41%
Millennials
50%
Gen Z
49%
Max = 50%. Widths: Boomers 62.00%, Gen X 82.00%, Millennials 100.00%, Gen Z 98.00%
How often do Americans read scripture outside services? (Pew, 2023–24)
Pew’s Religious Landscape Study asked specifically about reading scripture outside of religious services. The results show a large “seldom or never” group, with about one-in-five reading at least weekly.
Frequency (outside services)
Share of U.S. adults
At least once a week
22%
Once or twice a month
7%
Several times a year
9%
Seldom or never
61%
Print vs. digital Bible access (ABS)
About one-third of Bible Users access the Bible only in print, while about two-thirds access it digitally at least some of the time.
Among digital Bible Users, Bible apps are the most common option, with Bible-based websites and YouTube also among the top platforms.
Methodology notes (why these numbers differ)
ABS “Bible Users” = interacting with the Bible on your own at least 3 times/year (not limited to print reading; excludes worship services).
Barna weekly reading = self-reported weekly Bible reading (question wording and sampling can produce differences vs. other surveys).
Sources
American Bible Society — State of the Bible: USA 2025 (PDF): https://www.americanbible.org/wp-content/uploads/2025/04/SOTB-2025-04-Final.pdf
American Bible Society — State of the Bible 2025 press release: https://www.americanbible.org/news/press-releases/articles/sotb-2025-release/
Barna — Bible reading trends (State of the Church 2025): https://www.barna.com/trends/bible-reading-trends/
Gloo — press release on State of the Church 2025 Bible reading: https://www.gloo.com/press/releases/millenials-and-gen-z-are-driving-a-bible-reading-comeback
Pew Research Center — Prayer and other religious practices (Religious Landscape Study 2023–24): https://www.pewresearch.org/religion/2025/02/26/prayer-and-other-religious-practices/
American Bible Society — State of the Bible: USA 2024 (PDF): https://1s712.americanbible.org/state-of-the-bible/stateofthebible/State_of_the_bible-2024.pdf